Market screener: crypto and forex by RSI, trend and volatility
Filter the main crypto pairs and currency pairs by momentum, trend, volatility and distance from their yearly high. Every number is calculated from real daily data in your browser.

What the screener does
A screener answers one question quickly: which markets currently meet the conditions I care about? Instead of opening thirty charts one by one, you set a few filters, such as “RSI below 30” or “in an uptrend”, and get a sorted table. The TradeProfy screener covers every spot pair trading on Binance (the 200 with the most traded value by default) and the major and emerging-market currency pairs from the European Central Bank’s daily reference rates.
Each row is calculated from real daily data in your browser. Nothing is cached on a server or bought from a data vendor, and nothing is guessed: if a source does not respond, the row is left out and the page tells you.
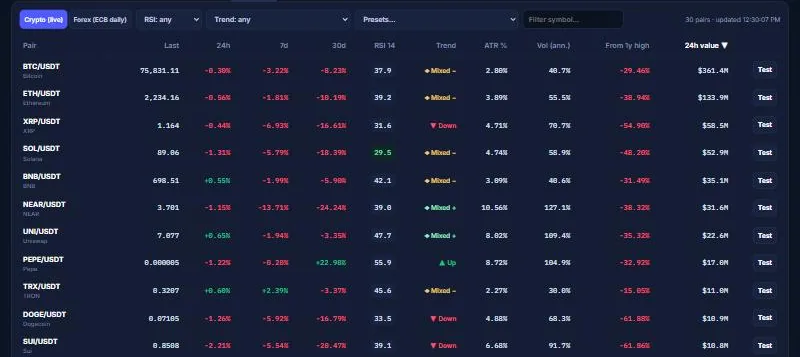
- Crypto or forex: switch the list of markets.
- RSI filter: show only rows inside an RSI range.
- Trend filter: up, down or mixed.
- Presets: ready-made filters to start from.
- Search: find one pair quickly.
- Last: the latest price.
- 24h, 7d and 30d: change over a day, a week and a month.
- RSI 14: daily momentum, 0 to 100.
- Trend: price against EMA 50 and EMA 200.
- ATR %: the average daily range in per cent.
- Volatility: annualised, from daily returns.
- From 1-year high: how far below the peak.
- 24h value: how much traded in a day.
- Test: send the market to the backtester.
Live updates, timers and new listings
The crypto tab is now live. Prices arrive about once a second over one Binance WebSocket for the whole market, and RSI, ATR, trend and volatility are recalculated from the cached daily history with today’s live price as the last bar. A status bar shows whether the feed is live, falling back to a five-second refresh, paused or offline, how many seconds ago the last update arrived, and countdowns to the daily (00:00 UTC) and weekly candle closes. The list of pairs is read from Binance when the page opens and every ten minutes, so new listings appear by themselves with a NEW badge.
The forex tab stays honest about its source: ECB reference rates are end-of-day, so the tab adds session clocks, a countdown to the next ECB publication and, where one exists, a clearly labelled live proxy price. Each market also has its own page with a longer guide: the live crypto screener and the forex screener.
The columns, explained
| Column | How it is calculated | Why it is useful |
|---|---|---|
| Last | Latest Binance price (crypto) or latest ECB reference rate (forex) | Context for the other columns |
| 24h / 1d | Rolling 24-hour change (crypto) or change between the last two ECB fixes (forex) | Today’s move |
| 7d, 30d | Close today versus the close 7 and 30 days earlier | Short and medium-term momentum |
| RSI 14 | Wilder’s 14-day Relative Strength Index on daily closes | How one-sided recent moves have been |
| Trend | Uptrend if price > EMA 50 > EMA 200; downtrend if price < EMA 50 < EMA 200; otherwise mixed | The regime the market is in |
| ATR % | 14-day average true range divided by price | Typical daily range, comparable across markets |
| Vol 90d | Annualised standard deviation of daily log returns over 90 days | How volatile the market has been for three months |
| From 1y high | Latest close versus the highest high of the last 365 days | Whether the market is near its highs or deep in a drawdown |
Annualised volatility uses 365 days a year for crypto, which trades every day, and 252 days for forex, which trades on weekdays. Without this adjustment, crypto volatility would look artificially low.
- Pair. The market, here SOL priced in USDT.
- 7-day change. −5.8% means it is 5.8% lower than a week ago.
- RSI 14. 29.5: recent closes were mostly down. It has fallen hard. It does not say it will stop falling.
- Trend. “Up” when price is above EMA 50 and EMA 50 is above EMA 200; “Down” when the order is reversed; “Mixed” otherwise.
- ATR %. The average daily range as a share of price. 4.7% means a stop 1.5 ATR away would be about 7% from the entry.
- From 1-year high. −48% means about half its peak value. Far from the high is not the same as cheap.
- 24h value. $53M traded in a day: enough activity for prices to be meaningful.
On the real screen: On the real screenshot below, pins 6 to 13 are these columns.
New-user habitUse a screener to make a short list, then open each one on the chart and in the planner.
Common mistakeBuy the top row of a sorted column. A filter only sorts the past.
Using the presets
- Pullback in uptrend. Markets in an uptrend (price above both averages, the 50 above the 200) whose RSI has dropped below 45. This is a common starting list for trend traders looking for dips.
- Strong momentum. Uptrend plus a 30-day gain above 10%. Useful for momentum and breakout traders, and a reminder of which markets are already extended.
- Within 5% of 1-year high. Markets close to their yearly highs, where breakout traders watch for new highs and others watch for resistance.
- Most volatile and Calmest. Sort by ATR % to see where the big daily ranges are. Volatile markets need smaller positions for the same risk.
Every preset is just a combination of the filters in the bar above the table. You can change any filter after choosing a preset, type in the search box to find one market, and click any column heading to sort.
From a row to a plan
Each row links to the next steps. Chart opens the market in Advanced Charts with the same daily data, so you can look at structure, levels and indicators. Test opens the backtester with that market loaded, so you can check whether the rule behind your filter has worked in the past, with fees. From the chart, a long or short position shows the size and net reward-to-risk, and the Trade Planner turns it into a full plan.
Worked example
Suppose you trade pullbacks in crypto uptrends and want a short list each morning. You choose the “Pullback in uptrend” preset. Three coins appear. You sort by ATR % to see which is calmest: one has an ATR of 3.1%, another 5.8%. For the same $100 of risk with a 1.5 × ATR stop, the calmer coin allows a position of about $2,150 (100 ÷ 0.0465) and the more volatile one about $1,150 (100 ÷ 0.087). Before trading either, you open both on a chart and check whether the pullback has reached a support zone. If not, you wait. The screener narrowed thirty markets to three; the chart and the plan decide.
Screening mistakes to avoid
- Treating a filter as a strategy. “RSI below 30” finds markets that have fallen; it does not tell you whether they will rebound. Test the rule first.
- Ignoring liquidity. Smaller coins can have wide spreads and thin order books. The heatmap on the markets page shows 24-hour traded value, which is a rough guide.
- Forgetting the clock. Crypto daily candles close at 00:00 UTC. A screen run in the middle of the day mixes a partial candle with complete ones.
- Comparing forex and crypto directly. An RSI of 65 means more on a calm currency pair than on a volatile coin. Use ATR % and volatility to put readings in context.
- Chasing the top of the momentum list. Markets with the strongest 30-day gains are often the most extended. Size them for their volatility.
Before buying a market that has slid down the list, compare it with the pencil lesson on pull-backs and falling knives in the chart-reading guide. The screener shows the size of the fall; the chart shows which of the two it is.
Why forex uses reference rates
There is no central exchange for currencies, and live dealing prices come from banks and brokers under their own licences. The European Central Bank publishes free reference rates for about 30 currencies against the euro once per working day, at around 16:00 Frankfurt time. TradeProfy converts them into pairs such as EUR/USD, USD/JPY and USD/INR by dividing one rate by another. These rates are ideal for daily statistics like RSI, volatility and trend on a daily timeframe. They are not dealing prices and have no intraday high or low, so the forex tab does not show ATR in the same way as crypto, and you should use your broker’s live quotes before trading.
How the trend label is defined
The trend label is deliberately simple and fully mechanical. A market is labelled an uptrend when the latest close is above its 50-day exponential moving average and the 50-day is above the 200-day. It is a downtrend when the order is reversed. Anything in between is mixed. This is a common definition, and you can reproduce it on any chart by adding EMA 50 and EMA 200 in Advanced Charts. Because both averages lag, the label changes after the trend has already turned. It is a description of where the market has been, which is still valuable for choosing which kind of setup to look for.
Building your own screening routine
- Pick one or two conditions that match the setups you already trade. Write them down.
- Run the screen at the same time each day, ideally soon after the daily candle closes at 00:00 UTC or after the ECB publishes its rates.
- Open each result on a chart and mark levels before looking at any indicator.
- Plan only the trades with a clear invalidation and a net reward-to-risk that meets your minimum.
- Track results by screen in the journal using a tag such as “screen-pullback”. After 30 or more trades, the per-tag statistics show whether the screen adds value.
Learn the indicators behind the columns
Each column is explained in depth in our guides: RSI, moving averages, ATR and volatility and correlation. Reading them once will make the table far more useful, and will help you spot when a reading is ordinary for one market and unusual for another.
How to read this screen, part by part
Every column in the screener is calculated in your browser from daily candles. Here is what each one means when it is high, low or average, and how the columns combine.
Last, 24h, 7d and 30d
The last price and its change over 24 hours (rolling), 7 and 30 calendar days for crypto, and 1, 7, 30 and 90 periods of working days for ECB forex rates.
Where it misleads: A large 24h move on a small coin can be one big trade. Check the 24h traded value before trusting it.
RSI 14
Relative strength over 14 daily closes with Wilder smoothing, on a 0–100 scale. Cells are tinted above 70 and below 30.
Where it misleads: A list of “RSI below 30” is a list of things that have fallen hard. Many keep falling; it is a place to look, not a buy list.
Trend label
Up when price is above the 50-day EMA and the 50 is above the 200. Down when price is below the 50 and the 50 below the 200. Mixed otherwise, with + or − showing whether price is above or below the 200.
Where it misleads: The label changes after the move; it describes the trend, it does not anticipate it.
ATR % and annualised volatility
ATR % is the 14-day average true range divided by the last price. Annualised volatility is the standard deviation of about 90 days of daily log returns, scaled to a year.
Where it misleads: Volatility measured over 90 days lags a sudden change; a crash or a squeeze shows up fully only weeks later.
From 1-year high and 24h value
How far the last price is below the highest high of the past year, and how much traded in the last 24 hours on Binance.
Where it misleads: A coin 80% below its high is not “cheap” because of that; the high may never return.
A step-by-step pass
- Choose Crypto (live) or Forex (ECB daily).
- Sort by 24h value first to see where the activity is.
- Apply a trend filter that matches what you trade: uptrends for pull-back setups, any trend for range setups.
- Add an RSI filter or a preset, and note how many rows are left.
- For each candidate, read ATR %: it tells you how wide a sensible stop is.
- Press Test to backtest a simple rule on that pair with fees and slippage.
- Open the chart, mark levels, and plan the trade with net reward-to-risk.
- Keep a note of why each pair was on your list, so you can review the screen later.
What this screen does not tell you
- Why a pair moved. The screener has no news.
- Order book depth or the spread you will pay on your exchange.
- Whether a pair is listed or legal to trade where you live.
- Future returns. A filter only sorts the past.
More cost tools
Crypto vs forex: questions readers ask
Where does the screener data come from?
Crypto rows are built from Binance public daily candles (about 400 days per market) and the rolling 24-hour statistics. Forex rows use European Central Bank reference rates from the Frankfurter API. Every figure is calculated in your browser when the page loads.
How often does it update?
Crypto prices stream in about once a second over Binance’s all-market WebSocket, and the indicators are recalculated with each update; if the stream is blocked the page falls back to a refresh every five seconds and says so. Forex figures change once per working day when the ECB publishes new reference rates, with a separately labelled live proxy where one exists.
Is a row in the screener a trade idea?
No. The screener filters markets by measurable conditions such as RSI or trend. It does not know your strategy, your costs or the news, and it never says buy or sell.
Why is RSI on forex less extreme than on crypto?
Major currency pairs move far less per day than most coins, and their moves are often more balanced between up and down days, so their RSI tends to stay closer to the middle.
What does “distance from 1-year high” mean?
How far the latest close is below the highest high of the last 365 days, in percent. Zero means the market is at its yearly high.
Can I add stocks?
Stock rows need a licensed data feed. They will appear only when such a feed is connected. TradeProfy does not fill gaps with estimated prices.
How is the RSI column in the screener calculated?
RSI uses 14 daily closes with Wilder smoothing: average gains divided by average losses, converted to a 0–100 scale. The last bar for crypto is the current UTC day, so the value moves during the day.
How does the screener decide uptrend or downtrend?
Uptrend means the last price is above the 50-day EMA and the 50-day EMA is above the 200-day EMA. Downtrend is the reverse. Anything else is Mixed, marked + if price is above the 200-day EMA and − if below.
What is ATR % in a screener and how do I use it?
ATR % is the 14-day average true range as a percentage of price. It tells you how far the pair usually moves in a day, which helps you set a stop outside normal noise and size the position so that the loss at the stop matches your risk.
Why do screener results change during the day?
Crypto rows use live Binance daily candles, so the current day’s candle, RSI and 24h figures update as prices move. Forex rows change once per working day, when the ECB publishes new reference rates.
What is the difference between crypto and forex trading?
Forex is the exchange of national currencies, traded mostly between banks five days a week, with very large volumes and small daily moves on major pairs. Crypto trades on exchanges every day around the clock, and coins often move several times more per day than major currencies. Regulation, leverage limits and taxes also differ by country.
Is crypto or forex better for beginners?
Neither is easy. Major forex pairs move less but are usually traded with leverage; crypto moves more but can be bought without leverage. What matters most for a beginner is small position size, low or no leverage and understanding the costs, whichever market you choose.
Is this crypto and forex screener free?
Yes. It runs in your browser without an account, using Binance public data for crypto and ECB reference rates for forex.
Why is the screener not working or showing data unavailable?
Usually a network or browser extension is blocking the data source; some countries and offices block crypto exchanges. The status bar names the source that did not respond. The forex tab uses a different source and usually still works.
How is it different from the TradingView screener?
TradingView’s screener covers many more markets with its own data licences and offers more filters on paid plans. This screener is smaller and free, shows every calculation openly, labels end-of-day data honestly and adds tools such as candle-close timers and a currency strength meter.
Does it include a trading bot or signals?
No. It filters markets by measurable conditions and never places trades or says buy or sell.

Written and maintained by Mantu Kumar
This page explains how to compare chart indicators across crypto and FX.