How to read a trading chart: a step-by-step guide for beginners
A chart is a diary of prices. This guide teaches it the way a teacher would with a pencil: one drawing at a time, every part numbered and explained, then the same part on a real screen. It ends with what many traders check before buying, when they usually stay out, and what to do when the whole market crashes.

Key takeaways
- A symbol has two halves: what you buy and what you pay with. Read it before the price.
- A candle is one block of time with four prices: open, high, low and close.
- Trend and levels come from the price itself; indicators only summarise it.
- No chart pattern is a guaranteed buy or sell signal. The stop comes first, then the size, then the entry.
- In a crash, the first job is to protect the account: leverage, stops and size, before any idea of buying.
- 4 October 2026 was a Sunday. The sell-off people remember happened in the days around it, and it is explained below with dates and sources.
What a chart is
A price chart is a diary. Time runs from left to right, price runs from bottom to top, and every mark on the screen is something that already happened. Nothing on a chart is a forecast. When people say “the chart says it will go up”, what they mean is “the past prices look like other past prices that went up”, and that is sometimes true and often not.
Reading a chart well is therefore not about predicting. It is about three calmer questions: what has price been doing, where would I be wrong, and how much could I lose. The steps below answer them in order. You can follow along on the TradeProfy advanced chart, which shows live crypto, forex and token prices for free, with no login.
The advanced chart page draws its six steps, from picking a symbol to planning the trade, as one pencil lesson.
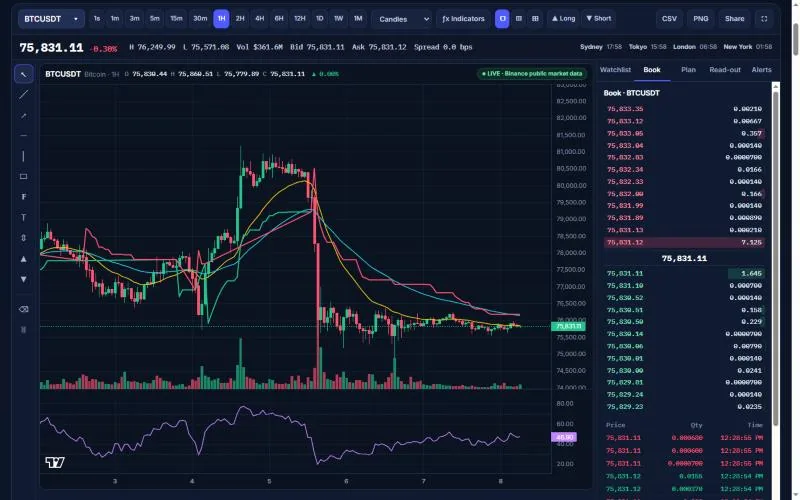
- Symbol box: type a pair or token to change the market.
- Timeframes: from one second to one month for crypto.
- Chart type: candles, bars, line or Heikin-Ashi.
- Indicators (ƒx): tick moving averages, RSI, SuperTrend and more.
- Long and Short: the position tool for planning a trade.
- Last price: the latest public trade, coloured by the 24-hour change.
- High, low, volume, bid and ask: the 24-hour range and the best prices in the book right now.
- Session clocks: which big markets are open at this moment.
- Drawing rail: lines, zones, Fibonacci, text and measure.
- Live badge: the data source and how fresh it is.
- Candles with EMA 20, EMA 50 and SuperTrend: the price and the indicators you switched on.
- Volume: how much traded in each hour.
- RSI pane: momentum from 0 to 100.
- Order book: asks above, bids below, read-only.
- TradingView logo: the charting library’s attribution. The data still comes from the sources named on the badge.
Step 1: read the symbol
Before you look at a single candle, read the name of the market. Most symbols have two halves. The first half is the thing being priced; the second half is the money the price is written in. If you mix them up, every number that follows means something else.
- BTCUSDT. BTC is the base, the thing you buy. USDT is the quote, the currency the price is written in (tether, a dollar-linked stablecoin). A price of 75,000 means one bitcoin costs 75,000 USDT. A rising chart means bitcoin is getting dearer in USDT.
- EUR/USD. The price of one euro in US dollars. 1.08 means one euro buys 1.08 dollars. When this chart rises the euro is getting stronger against the dollar; when it falls, the dollar is getting stronger.
- NSE:RELIANCE. An exchange prefix and a company ticker. The same company can trade on two exchanges (NSE and BSE in India) at slightly different prices, so the prefix matters. You will see this style on brokers’ charts and in the World markets widgets.
- SPYXUSD. A token that follows the SPY exchange-traded fund, traded here as a perpetual futures contract on Delta Exchange India and priced in dollars. It follows SPY, but it is not SPY, and it trades when SPY is closed.
On the real screen: Pin 1 on the real screenshot is the symbol box.
New-user habitRead the quote currency before you read the price. 1,000 in USDT and 1,000 in rupees are very different amounts.
Common mistakeCompare two symbols by their price level. A higher number does not mean a better or a riskier market.
Step 2: choose the timeframe
Every chart has a timeframe: how much time one candle covers. The same market can look like a rocket on the 5-minute chart and like a slow decline on the weekly chart. Neither is wrong; they answer different questions.
| Timeframe | One candle = | Who usually looks at it |
|---|---|---|
| 1m – 15m | 1 to 15 minutes | Intraday traders timing an entry they already planned |
| 1H – 4H | 1 to 4 hours | Swing traders holding for days |
| 1D | One day | Most people; the best starting point for beginners |
| 1W – 1M | One week or month | Long-term investors checking the big trend |
A simple habit: look at the daily chart first to see the big direction, then the 1-hour chart to see the detail. If the two disagree, you have learned something important: the short-term move is going against the bigger one.
Step 3: read one candle
A candle packs four prices into one shape. The thick part, the body, runs from the opening price to the closing price. The thin lines, the wicks, reach up to the highest price and down to the lowest price traded in that block of time.
- High. The top of the thin line (the upper wick) is the highest price traded during that candle’s time.
- Close of a green candle. The top of the thick body. The candle is green because the last price of the period was higher than the first.
- Open of a green candle. The bottom of the body: the first trade of the period.
- Low. The bottom of the lower wick is the lowest price traded during that time.
- Open of a red candle. On a red candle the order flips: the open is the top of the body, because price started high.
- Close of a red candle. The bottom of the body. The period finished lower than it started, so the candle is red.
On the real screen: Pin 11 on the real screenshot shows real candles with the same four prices. Hover over any candle and the open, high, low and close appear in the top-left legend.
New-user habitRead the wicks as well as the colour. A long lower wick says sellers pushed price down and buyers pushed it back before the close.
Common mistakeTreat one green candle as a reason to buy. A candle describes one block of time that has already ended.
A few shapes come up again and again. A long body with tiny wicks means one side controlled the whole period. A small body with long wicks on both sides (a doji) means price travelled a lot but ended near where it started: indecision. A long lower wick after a fall means sellers pushed price down and buyers pushed it back up before the close. None of these is a signal by itself; they describe one period that has already ended. The candlestick patterns guide goes further.
Step 4: know the four ways to draw the same prices
Charting tools offer several pictures of the same data. Candles are the default for good reason, but the others have their uses, as long as you know what each one hides.
- Candles. Every open, high, low and close, with colour for direction. The default, and the best view for most people.
- OHLC bars. The same four prices as a vertical line with a tick to the left (open) and a tick to the right (close). Less colour, the same information.
- Line of closes. Only the closing prices, joined up. Calm and clear for a long view, but it hides the wicks, so you cannot see how far price travelled inside each bar.
- Heikin-Ashi. Each bar is averaged with the previous one. Trends look smoother and long runs of one colour are easier to see, but the prices on these bars never actually traded.
On the real screen: Pin 3 on the real screenshot is the chart-type menu where you switch between these four views.
New-user habitUse Heikin-Ashi or a line to see the trend, then switch back to candles before you place a stop or read an exact level.
Common mistakeRead an entry or a stop price from a Heikin-Ashi bar. It is an average, not a real trade.
Step 5: find the trend and the levels
A trend is simply the direction of the highs and lows. In an uptrend each high is higher than the last and each low is higher than the last. In a downtrend both are lower. When highs and lows go nowhere, the market is in a range. You can see this with your own eyes before you add a single indicator.
A level is a price where the market turned before: an old high, an old low, or an area where price paused several times. Traders call levels below the price support and levels above it resistance. They are not walls. They are places where many people remember something happened, so they are worth watching.
- Trend line. A line joining two or more rising lows (or falling highs). It shows the slope of the move. It needs at least two touches to mean anything.
- Level. A horizontal line at an old high or low where price turned before. Old highs often become places where sellers show up again.
- Zone. A box instead of a line, because markets turn in areas, not at one exact price.
- Fibonacci levels. Lines at 38.2%, 50% and 61.8% of a move. Traders use them to mark where a pull-back might pause. They are ratios, not magic.
- Text note. Write what you are waiting for, for example “wait for a close above”. Reading your own rule later stops you from changing it in the heat of the moment.
- Measure. Drag across a move to see its size in per cent and in bars. Useful to compare today’s move with earlier ones.
On the real screen: Pin 9 on the real screenshot is the drawing rail. Press Esc to go back to the normal cursor; select a drawing and press Delete to remove it.
New-user habitDraw from wick to wick or from close to close, and do it the same way every time.
Common mistakeKeep redrawing a line until it fits the trade you already want. A line drawn to fit is a guess.
The support and resistance guide and the Fibonacci guide cover levels in more depth.
How to read a triangle pattern
Mark the swing highs and lows with two trend lines. An ascending triangle has a roughly level upper boundary and rising lows. A descending triangle has a roughly level lower boundary and falling highs. In a symmetrical triangle, both boundaries converge. Label the boundaries before watching the next candles, so you can record whether price closed through one of them or only traded beyond it briefly.
Use the drawing controls on the chart terminal to mark the swings. Record the timeframe and whether the bar actually closed beyond the line. A break can reverse back inside the range.
Step 6: check the volume
Volume is the bars at the bottom of the chart: how much traded in each candle. It answers one question: how many people took part in this move? A breakout above a level on volume two or three times the recent average has more participation behind it than one on thin volume. A big red candle with a huge volume bar during a fall often marks forced selling, such as liquidations.
Two cautions. On crypto, the volume you see is for one exchange, not the whole market. And for forex there is no central exchange at all, so many charts have no meaningful volume. The VWAP and volume guide explains more.
Step 7: add two or three indicators
An indicator is a formula applied to past prices. A moving average smooths them. RSI measures how one-sided recent closes were. ATR measures how far price usually travels in a bar. They are useful summaries, but they are always built from the same candles you can already see, so they cannot add information that is not on the chart.
- EMA 20. The 20-bar exponential moving average: a fast line that hugs price. When price stays above a rising EMA 20, the short-term move is up.
- EMA 50. A slower average. It changes direction later. Many traders read the trend from where price sits against the 50 and whether the 20 is above or below it.
- Bollinger band. An envelope two standard deviations around a 20-bar average. Wide band means a jumpy market; a narrow band means a quiet one. Touching the band is not a signal by itself.
- RSI pane. RSI (14) opens in its own pane, scaled from 0 to 100. It compares the size of recent up-closes with recent down-closes.
- The 70 line. Above 70, recent closes were mostly up. In a strong uptrend RSI can stay above 70 for weeks while price keeps rising.
- The 30 line. Below 30, recent closes were mostly down. In a crash RSI can sit under 30 while price keeps falling. “Oversold” is a description, not a floor.
On the real screen: Pin 4 on the real screenshot opens the indicator menu; pin 11 shows EMA 20 and EMA 50 on real candles; pin 13 is the RSI pane.
New-user habitPick two or three indicators that answer different questions: trend (an average), momentum (RSI) and volatility (ATR).
Common mistakeStack eight indicators until one of them agrees with what you already wanted to do.
A sensible beginner set is one moving average for the trend (EMA 50 or 200), RSI 14 for momentum, and ATR 14 for how wide a stop needs to be. Our guides on moving averages, RSI, MACD and Bollinger Bands show the maths behind each one.
“Buy signals” and “sell signals”: what traders actually check
Every beginner asks the same question: on which signal should I buy, and on which should I not? The honest answer is that no single signal works on its own, every time. What experienced traders have instead is a short list of conditions they like to see before they consider a trade, and a list of situations where they usually stay out. The list below describes those habits. It is education, not a recommendation to buy or sell anything.
- Higher low. In an uptrend each dip stops above the last one.
- Back to a level. Price pulls back to an area that mattered before. There is a clear place to be wrong: below that level.
- Close back above. A candle closes back above the level. Many traders wait for this close instead of buying the dip on the way down.
- Lower low. In a fall each low is below the last. There is no base yet.
- “RSI 24, cheap!” An oversold reading on its own. There is no level to put a stop under, so there is no way to size the trade.
New-user habitAsk: where is my stop, and how big is the size that fits it?
Common mistakeBuy a falling market because an indicator says “oversold”.
| What many traders want to see before buying | Why it matters |
|---|---|
| The daily trend is up: higher highs and higher lows, price above a rising 50- or 200-day average | Buying with the bigger direction means fewer fights against it |
| A pull-back to a level that mattered before | It gives a clear place to be wrong: just below that level |
| A candle that closes back above the level | Waiting for the close avoids buying a dip that is still falling |
| A stop and a size that fit the account | If the loss at the stop is more than you planned to risk, there is no trade |
| A reward at least twice the risk after costs | Costs eat thin plans; the trade planner shows the net number |
| When many traders usually stay out | Why |
|---|---|
| The market keeps making lower lows (a “falling knife”) | There is no base, so there is no sensible place for a stop |
| The only reason is “RSI is under 30” or “it fell a lot” | In a strong fall RSI can stay low for weeks while price keeps dropping |
| A big news event is minutes away | Spreads widen and prices can jump past a stop |
| They already lost their daily limit | The next trade is usually an attempt to win it back, not a plan |
| They cannot say, in one sentence, what would prove them wrong | Without an exit, a small loss can become a big one |
The same habits work in reverse for people who sell short: a downtrend, a bounce into an old level, a close back below it, and a stop above. Most beginners are better off learning to stay out than learning to short.
Step 8: stop first, then size, then the entry
This is the step that separates traders who last from traders who do not. Before you think about how much you could make, decide where you are wrong. That price is your stop. Then decide how much money you accept losing if it is hit, often 0.5% to 1% of the account. The size of the position is simply one divided by the other.
The trade planner draws this rule with two stops of different width and the same $100 of risk, and does the division for you.
Costs then decide how often you must win. A plan that aims for 2.4 times its risk only needs to win about 31% of the time after costs. A plan that aims for 1 times its risk needs to win more than half the time. The position size calculator and the trade planner do this arithmetic for you.
The trade planner shows this break-even with costs already inside the win and the loss, and compares it with your own hit rate.
What a market crash is
Markets fall all the time. Words for the size of the fall help you keep perspective. They are conventions, not laws, but most news outlets use them the same way.
| Word | Usual meaning |
|---|---|
| Dip or pull-back | A fall of less than about 10% from a recent high |
| Correction | A fall of 10% to 20% from the high |
| Bear market | A fall of 20% or more from the high, usually lasting months |
| Crash | A very fast, large fall over days, often with panic selling |
Exchanges have brakes for the worst days. In India, a market-wide circuit breaker halts all equity trading if the Nifty 50 or the Sensex falls 10%, 15% or 20% in a day. In the US, trading pauses if the S&P 500 falls 7% or 13% and stops for the day at 20%. South Korea’s Kospi triggered its own breaker on 15 October 2026.
The arithmetic of recovery is the part most people underestimate. A fall needs a bigger rise to get back:
| Fall | Rise needed to get back |
|---|---|
| −10% | +11.1% |
| −20% | +25.0% |
| −30% | +42.9% |
| −50% | +100% |
That is why protecting the account during a fall matters more than catching the exact bottom.
The six stages of a sell-off, from the first crack to a slow recovery, are drawn in the November 2026 AI stocks sell-off page.
What to do on the day the screen turns red
A crash day feels like an emergency, and emergencies make people click. The most useful thing you can do in the first hour is usually less, not more. Check the things that can actually hurt you: leveraged positions, margin, stops that are missing. Then follow the plan you wrote when you were calm.
A do and don’t list for the day itself is drawn in the AI stocks sell-off page: stop clicking, read the timeframe, keep the stop, check leverage.
If you trade with leverage, a crash is where the account is lost. A 10% fall wipes out a fully leveraged 10x long. Exchanges sell (liquidate) such positions automatically, and that forced selling is one reason crash days have such big volume bars. Read how liquidation works before you ever use leverage.
When do people buy after a crash?
Nobody knows where the bottom is while it is happening. People who buy well after big falls usually share three habits, and none of them is “guess the low”:
- They decided before the fall. Long-term investors who already wanted to own an index often write down in advance: one part if it falls 10%, another at 20%, another at 30%. If the lower levels never come, the cash stays unused.
- They use money they will not need for years, never borrowed money, and they keep an emergency fund outside the market.
- They keep regular investing going. A monthly SIP buys more units when prices are low, without any decision on the day. The SIP calculator shows how that works over time.
- First part at −10%. A long-term investor who already wanted to buy decides in advance to put in one part if the market falls 10% from its high.
- Second part at −20%. Another part if it falls 20%, the usual definition of a bear market.
- Third part at −30%. A last part if it falls 30%.
- Cash you will not need. Only money you will not need for years, and never borrowed money. If price never gets to the lower lines, part of the cash stays unused, and that is fine.
New-user habitDecide the levels and the amounts before the fall, in writing.
Common mistakeUse this idea for leveraged trading. It is a habit for long-term, unleveraged investing.
Short-term traders are different: most wait for the market to stop making lower lows, for volatility to calm and for a close back above a level, and then size small. Even then, many first bounces fail. The Risk Lab shows how a run of losses looks at different risk levels.
What happened around 4 October 2026?
Many people search for “the market crash of 4 October 2026”. The date itself is a useful lesson in reading carefully: 4 October 2026 was a Sunday, and no stock exchange traded that day. What people usually mean is the sell-off in the days around it, which hit India first, then Asian technology shares, and finally US AI stocks a month later. Here is what the reports listed under Sources say, in order.
- 1 October (Thursday): the Nifty and the Sensex closed their eighth losing week in a row, the longest such streak in about 25 years. The Nifty lost 3.11% that week to 22,421.95 and about 8.7% across the eight weeks. Reports named record selling by foreign investors, crude oil near or above $100 a barrel, and high US bond yields. Friday 2 October was a market holiday.
- 4 October (Sunday): markets were closed. Weekend reports looked ahead to the RBI’s decision and the start of results season.
- 6 October: in the US, the S&P 500 and the Nasdaq closed at record highs. US and Indian markets were moving in opposite directions.
- 7 October: the Reserve Bank of India raised the repo rate by 0.25 percentage points to 5.50%, its first increase since early 2023, and changed its stance to “calibrated tightening”.
- 8 October: Brent crude rose above $104. The Sensex fell more than 1,000 points to a 32-month low and the Nifty dropped below 22,250, an 18-month low.
- 10 October: the eight-week losing streak ended as crude eased.
- 15 October: South Korea’s Kospi fell 7.57% and Japan’s Nikkei 225 fell 4.90%, after hotter US inflation data (3.7% a year in September) and doubts about the profits from AI spending.
- 5 November: the US AI sell-off: the S&P 500 fell 4.4% and the Nasdaq 5.5%. Our AI stocks sell-off page has the full timeline.
What a beginner could have learned from it
The causes were things you can watch on a chart and a calendar: an oil price near $100, rising yields, foreign selling showing up week after week, and a central-bank meeting with a date. None of them told anyone the day of the low. What helped people through it was plain risk control:
- Traders who had a stop and a size before each trade lost what they planned and no more.
- Traders on high leverage were the ones forced out at the worst prices.
- Long-term investors who kept their monthly investing going bought more units at lower prices without having to guess.
- People who “bought the dip” on 1 October because it “had fallen a lot” saw it fall further on 7 and 8 October. Waiting for a base, or buying in planned stages, would have made that less painful.
What to do next time
Write your crash plan now, while markets are calm: your maximum leverage, the most you will risk on one trade, which long-term holdings you will not sell in a panic, and the levels at which you would add if you are a long-term investor. Then put alerts at those levels on the chart and close the screen. The World markets page shows the oil price, the dollar, the VIX and major indices on one screen, so you can see the backdrop at a glance.
A ten-minute daily routine
- Open the daily chart. Is the trend up, down or sideways? Write one word.
- Mark the nearest level above and below the price.
- Check RSI and ATR: is the market stretched, and how wide would a stop be?
- Look at the calendar: any central-bank decision, inflation data or results today?
- If a setup from your list appears, plan it in the trade planner: stop, size, net reward-to-risk.
- Set an alert, close the chart, and come back when it fires.
Ten calm minutes with a written plan beat two hours of staring at a 1-minute chart.
Sources
- Business Today: Nifty, Sensex log 8th straight weekly loss (2 Oct 2026)
- HDFC Sky: Market close report, 1 October 2026
- Liquide: Weekly review, Nifty −3.11% to 22,421.95
- JM Financial: RBI hikes repo rate by 25 bps; US record closes on 6 Oct (7 Oct 2026)
- Moneylife: Nifty, Sensex plunge as crude surges past $104 (8 Oct 2026)
- OneIndia: Sensex-Nifty crash as crude tops $104 (8 Oct 2026)
- NewKerala: Sensex, Nifty end eight-week losing streak as crude eases (10 Oct 2026)
- Crypto Briefing: Kospi plunges 7.57% (15 Oct 2026)
- The Korea Herald: Kospi plunges as AI profitability fears rattle Asia; Nikkei −4.90% (15 Oct 2026)
- Tech Insider: Kospi crash, AI doubts and US CPI 3.7%
- TradeProfy: AI stocks sell-off, November 2026 (sources for 5–6 Nov)
Written 8 November 2026 from the reports above. Index levels and dates are as reported; check the original source for anything you rely on.
Related guides and tools
- Candlestick patternsWhat common candle shapes describe, and where they mislead.
- Support and resistanceHow to mark levels and zones without fooling yourself.
- RSI indicator guideWhat 30 and 70 really mean in trends and ranges.
- How to calculate position sizeRisk-based sizing step by step.
- The November 2026 AI sell-offDated timeline, causes and the arithmetic of recovery.
Frequently asked questions
How do I start reading a trading chart?
Read the symbol first (what is priced, in what currency), then pick the daily timeframe, look at whether highs and lows are rising or falling, and mark the nearest levels above and below price. Add indicators only after that.
Which timeframe should a beginner use?
Start with the daily chart. Each candle is one day, so there is less noise and more time to think. Use the 1-hour chart only to look closer at a plan you already made on the daily.
What does a green or red candle mean?
Green means the period closed higher than it opened; red means it closed lower. The colour describes one period that has already ended. It is not an instruction to buy or sell.
Is there a reliable buy signal?
No single signal works every time. Many traders look for a set of conditions together: an uptrend on the daily chart, a pull-back to a level, a close back above it, and a stop and size that fit the account. Even then many trades fail, which is why the size comes from the stop.
Does RSI under 30 mean I should buy?
Not on its own. RSI under 30 means recent closes were mostly down. In a strong fall it can stay under 30 for weeks while price keeps falling. It describes momentum; it does not mark a bottom.
What is the difference between a correction, a bear market and a crash?
By common convention a correction is a fall of 10% to 20% from a high, a bear market is a fall of 20% or more lasting months, and a crash is a very fast, large fall over a few days, often with panic selling.
What should I do when the stock market crashes?
Check leverage and margin first, keep the stops you set before the fall, reduce size while volatility is high, and avoid new decisions based on one headline. Long-term investors often keep their regular investing going rather than selling in a panic. This is education, not advice.
Should I buy the dip?
It depends on your plan, not on the size of the fall. Long-term investors often buy in stages decided in advance, with money they will not need for years. Short-term traders usually wait for a base and a clear place for a stop. Buying only because something “fell a lot” is a common mistake.
Why did markets fall in early October 2026?
In India, reports pointed to record foreign selling, crude oil near or above $100 a barrel and high US bond yields, followed by the RBI’s rate rise to 5.50% on 7 October. Asian technology shares then fell sharply on 15 October on inflation data and doubts about AI profits.
Did the stock market crash on 4 October 2026?
No. 4 October 2026 was a Sunday and no stock exchange traded. The sell-off people refer to happened on the trading days around it, especially 1, 7 and 8 October in India and 15 October in South Korea and Japan.
Why does the position size come from the stop?
Because the stop is where you are wrong. If you accept losing $100 and the stop is $5 away, the size is 20 units. A wider stop means a smaller size, so the money at risk stays the same.

Written and maintained by Mantu Kumar
Mantu builds the TradeProfy calculators and checks every formula with worked examples. Each page lists its data sources and assumptions. TradeProfy explains costs and maths but never tells you what to buy or sell.